N.B. The † prefixed to a number denotes that it is
above
, the * that it is
below
the average by the percentage which it expresses.
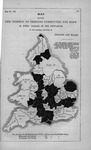
table SHOWING THE AMOUNT OF IGNORANCE AMONGST THE CRIMINALS IN THE DIFFERENT COUNTIES OF ENGLAND AND WALES IN THE UNDERMENTIONED YEARS.
COUNTIES.
Average Annual Number of Criminals from
-
48
.
Number of Criminals who could neither read nor write.
Average Number per Year.
No. of Criminals who can neither read nor write in every
100
.
Per Cent. above and below the Average. † denotes above. * " below.
TOTAL FOR ÈNGLAND AND WALES. .
LIST OF COUNTIES IN THE ORDER OF THE IGNORANCE AMONGST THEIR CRIMINALS, AS SHOWN BY THE NUMBER OF PERSONS WHO COULD NEITHER READ NOR WRITE IN EVERY
100
CRIMINALS.
Counties above the Average.
Counties below the Average.
Hereford ........
Oxford ........
Hertford ........
Rutland ........
Bedford ........
Cambridge ......
Salop............
Stafford ........
Essex ..........
Sussex ..........
Lancaster ......
Berks ..........
North Wales ....
Nottingham ....
Norfolk ........
Cornwall ......
South Wales ....
York............
Warwick........
Leicester ........
Chester ........
Gloucester ......
Worcester ......
Monmouth ....
Suffolk..........
Devon ..........
Somerset........
Southampton....
Bucks ..........
Surrey ..........
Kent............
Lincoln ........
Dorset ..........
Cumberland ....
Hunts ..........
Northumberland
Durham ........
Wilts ..........
Northampton ..
Middlesex ......
Average for England and Wales
Westmorland....
THE COUNTIES ARRANGED CRIMINALLY AND TOPOGRAPHICALLY (
to show the local association of crime
).
DIVISION I.—
Northern, Welsh, and Cornish Counties.
DIVISION IV. —
South Eastern and South Western.
No. of Criminals in
10,000
.
No. of Criminals in
10,000
.
Cumberland ....
Berks ..........
Durham ........
Devon ..........
Westmorland....
Dorset ..........
Northumberland
Sussex ..........
North Wales ....
Surrey ..........
South Wales ....
Kent............
Cornwall........
Hants ..........
DIVISION II.—
York and N. Midland Counties.
Wilts............
York............
DIVISION V. —
Western and North Western.
Rutland ........
Shropshire ......
DIVISION III.—
S. Midland & Eastern Counties.
Leicestershire....
Hunts ..........
Chester..........
Northampton ..
Warwick ........
Cambridge ....
Hereford ........
Bedford ........
Worcester ......
Suffolk ........
Gloucester ......
Norfolk ........
DIVISION VI. —
Metropolitan.
Bucks ..........
Middlesex ......
The Northern, Welsh, and Cornish Counties range in criminality from
7
.
1
to
8
.
4
in
10,000
.
York and the N. Midland Counties, from
11
.
4
to
13
.
9
.
The S. Midland and Eastern Counties, from
14
.
1
to
20
.
4
.
The S. Eastern and S. Western, from
12
.
9
to
19
.
9
.
The Western and N. Western, from
14
.
9
to
26
.
1
.
table SHOWING THE RELATIVE CRIMINALITY AND IGNORANCE OF THE SEVERAL COUNTIES, ARRANGED ACCORDING TO THE OCCUPATION OF THEIR INHABITANTS.
No. of Criminals in every
10,000
of Pop.
No. of Persons who signed with Marks in every
100
married.
No. of Crimiminals in every
10,000
of Pop.
No. of Persons who signed with Marks in every
100
married.
Lincoln................
Chester................
Rutland ..............
Nottingham ..........
Huntingdon ..........
Leicester ..............
Cambridge ............
Warwick ..............
Essex ................
Worcester..............
Hereford ..............
Durham ..............
Agricultural and Sub- Manufacturing Counties.
Cornwall ..............
Manufacturing and Sub- Mining Counties.
Norfolk................
Derby ................
Suffolk ................
Stafford................
Hertford ..............
Agricultural and Sub- Mining Counties.
Buckingham ..........
Salop ................
Northampton..........
North Wales ..........
Oxford ................
South Wales ..........
Berks..................
Sub--Agricultural and Sub-Mining Counties.
Wilts..................
Northumberland ......
Dorset ................
Cumberland ..........
Somerset ..............
Monmouth ............
Sub--Agricul. and Sub- Manufact. County.
Gloucester ............
Sub-Metropolitan Counties.
Lancaster..............
Surrey ................
Yorkshire ............
Kent ..................
For definition of Agricultural, Manufacturing, and Mining Counties, see Table of Density of Population, No.
37
.
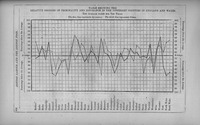
Table Showing the Relative Degrees of Criminality and Ignorance in the Different Counties in England and Wales. the average Taken For
Ten
Years.
The thin line represents Ignorance. The thick line represents Crime.
EDUCATION OF CRIMINALS (ENGLAND AND WALES).
table SHOWING THE DEGREES OF INSTRUCTION OF PERSONS OF ALL AGES COMMITTED TO PRISON FROM
TO
.
Years.
Unable to read or write.
Able to read and write imperfectly.
Able to read and write well.
Superior Instruction.
Instruction could not be ascertained.
Total.
table SHOWING THE CENTESIMAL DEGREES OF INSTRUCTION OF PERSONS OF ALL AGES COMMITTED TO PRISON FROM
TO
.
Years
Unable to read or write.
Able to read and write imperfectly.
Able to read and write well.
Superior Instruction.
Instruction could not be ascertained.
*** "The instruction of the offenders," say the Criminal Returns of
, "has been without much variation, exhibiting, on a comparison of the last
ten
years, a
decreased
proportion of those entirely uninstructed;" and it may be added a corresponding
increase
of those who are able to read and write imperfectly.
THE STATE OF EDUCATION AND DENSITY OF THE POPULATION IN THE SEVERAL COUNTIES COMPARED.
Counties having great Ignorance and great density of Population.
Percentage above and below the Average.
Counties having little Ignorance and great density of Population.
Percentage above and below the Average.
In No. signing register with Marks.
In No. of Persons to
100
Acres.
In No. signing register with Marks.
In No. of Persons to
100
Acres.
Lancaster ..
Surrey ......
Stafford ....
Kent ........
Worcester....
Gloucester ..
Chester ......
Durham ....
Counties having little Ignorance and little density of Population.
Counties having great Ignorance and little density of Population.
Devon ......
Hertford ....
Sussex ......
Essex........
Dorset ......
Hunts ......
Oxford ......
Rutland ....
Lincoln......
Salop ........
Derby ......
Suffolk ......
*** The rule appears to be, that those counties are the
most
ignorant in which the population is the
least
dense.
THE CRIME AND DENSITY OF THE POPULATION OF THE SEVERAL COUNTIES COMPARED.
Counties having great Crime and great density of Population.
Percentage above and below the Average.
Counties having great Crime and little density of Population.
Percentage above and below the Average.
In Number of Criminals.
In No. of Persons to
100
Acres.
In Number of Criminals.
In No. of Persons to
100
Acres.
Gloucester ..
Hereford ....
Worcester....
Bucks ......
Middlesex....
Somerset ....
Chester ......
Essex ......
Lancaster ....
Oxford ......
Stafford ....
Hertford ....
Counties having little Crime and little density of Population.
Counties having little Crime and great density of Population.
Cornwall ....
Durham ....
Northumb. ..
Surrey ......
South Wales
Kent ........
*** The rule appears to be, that those counties are the least criminal in which the population is the least dense.
N.B. The † prefixed to a number denotes that it is
above
, the * that it is
below
the average by the percentage which it expresses.
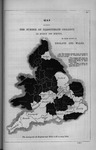
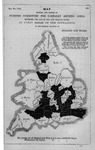
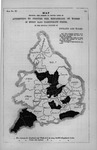
MAP
SHOWING THE NUMBER OF ILLEGITIMATE CHILDREN IN EVERY
BIRTHS, IN EACH COUNTY OF ENGLAND AND WALES.
*** The counties printed
black
are those in which the number of Illegitimate Births is
above
the Average. The counties left
white
are those in which the number of Illegitimate Births is
below
the Average. The Average is taken for
four
years (as long as the returns will allow).
The Average for all England and Wales is
67
in every
.
A table SHOWING THE NUMBER OF ILLEGITIMATE BIRTHS IN ENGLAND AND WALES IN THE UNDERMENTIONED YEARS.
***
The average is calculated for as long a series of years as the returns of the Registrar General will permit.
COUNTIES.
Total Number of Births for
4
Years, from
-
48
.
Average per Year.
Number of Illegitimate Births.
Average per Year.
Proportion to all Births,
1
in every
Number of illegitimate in every
Births.
Per Cent. above and below the Average. †denotes above * " below
Total for England and Wales . . .
LIST OF COUNTIES IN THE ORDER OF THEIR ILLEGITIMATE BIRTHS, AS SHOWN BY THE NUMBER OF ILLEGITIMATES IN EVERY
CHILDREN BORN.
Counties above the Average.
Counties below the Average.
Cumberland ............
Cambridge ............
Norfolk ................
Dorset ..................
Hereford................
Lincoln ..................
Salop ..................
Worcester ................
Nottingham ............
Gloucester ..............
Chester ................
Somerset ..............
Westmorland ..........
Southampton ..........
Suffolk ................
Northampton ..........
Derby ..................
Essex ..................
Berks ..................
Durham ................
Leicester................
Warwick................
North Wales............
Rutland ................
Lancaster ..............
Kent ..................
Bedford ................
Devon..................
Oxford ................
Monmouth ............
Northum berland........
Hunts ..................
Hertford................
Cornwall ................
South Wales...........
Surrey ..................
York ..................
Middlesex ................
Bucks ..................
----
Wilts ..................
Average for England and Wales ..................
Stafford ................
Sussex ..................
THE EARLY MARRIAGES AND THE INCREASE OF THE POPULATION IN EACH COUNTY COMPARED.
Counties in which the Increase of the Population and the number of Early Marriages are both above the Average.
Rate of Increase of the Population from
to
per cent.
Annual No. of Early Marriages in every
Marriages, from
-
48
.
Counties in which the Increase of the Population is below the Average, and the number of Early Marriages is above it.
Rate of Increase of the Population from
to
per cent.
Annual No. of Early Marriages in every
Marriages, from
-
48
.
Among Males.
Among Females.
Among Males.
Among Females.
Lancaster ..........
Cambridge ........
Stafford ............
Worcester..........
Bedford ..........
York ..............
Chester ............
Hunts..............
Counties in which the Increase of the Population and the number of Early Marriages are both below the Average.
Nottingham ......
Northumberland ..
Norfolk............
Southampton ......
Suffolk ............
Cumberland ......
Northampton ......
Gloucester ........
Leicester ..........
Devon ............
Berks ..............
Rutland ..........
Bucks..............
Cornwall ..........
Oxford ............
North Wales ......
Wilts ..............
Hereford ..........
Counties in which the Increase of Population is above the Average, and the number of Early Marriages is below it.
Salop ..............
Middlesex ........
Counties in which the Increase of the Population and the Early Marriages among Females are above the Average and those among Males below it.
Monmouth ........
Durham ..........
Counties in which the Increase of the Population and the Early Marriages among Males are below the Average and those among Females above it.
County in which the Increase of the Population and Early Marriages among Females are below the Average, and those among Males above it.
Counties in which the Increase of the Population and Early Marriages among Females is below the Average and those among Males above it.
Warwick ..........
Somerset ..........
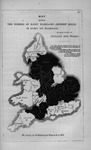
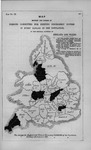
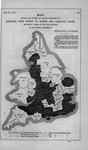
MAP
SHOWING THE NUMBER OF EARLY MARRIAGES AMONGST MALES IN EVERY
MARRIAGES, IN EACH COUNTY OF ENGLAND AND WALES.
*** The counties printed
black
are those in which the number of Improvident Marriages is
above
the Average. The counties left
white
are those in which the number of Improvident Marriages is
below
the Average. The Average is taken for
five
years (as long as the returns will allow).
The Average for all England and Wales is
43
in
.
table SHOWING THE NUMBER OF EARLY MARRIAGES OF MALES AND FEMALES IN THE SEVERAL COUNTIES
FOR THE UNDERMENTIONED YEARS.
***
The returns of the Registrar do not admit of the average being calculated from a longer series of years.
COUNTIES.
Annual Average Number of Marriages from
-
48
.
Number of Early Marriages.
Average per year.
Proportion to all Marriages,
1
in every
Number of early Marriages to every
.
p Cent. above and below the Average. † denotes above * " below
Males
Females
Males
Females
Males
Females
Males
Females
Males
Females
Males
Females
Males
Females
Males
Females
Males
Females
Males
Females
Total for England & Wales
LIST OF COUNTIES IN THE ORDER OF THEIR EARLY MARRIAGES, AS SHOWN BY THE NUMBER OF MARRIAGES, UNDER
TWENTY-ONE
YEARS OF AGE, IN EVERY
MARRIAGES.
AMONGST MALES.
AMONGST FEMALES.
Counties above
the Average.
Counties below
the Average.
Counties above
the Average.
Counties below
the Average.
Bedford ..
Gloucester
Huntingdon
Warwick ..
Hunts ....
Lincoln ..
Bedford ....
Cornwall ..
Leicester ..
Northumb.
Cambridge
Westmor...
Hertford ..
Sussex ....
Hertford ...
Rutland....
Bucks ....
Rutland ..
Essex ......
Dorset ....
Cambridge
Durham ..
Bucks......
Northumb.
Northamp.
Cumberland
Northamp.
Southamp.
Wilts ....
Cornwall..
York ......
Somerset ..
Stafford ..
Westmor.
Leicester ..
Monmouth
Nottingham
S. Wales ..
Stafford ....
Cumberland
Essex ....
Salop......
Wilts ......
Gloucester
York ....
Monmouth
Suffolk ....
Shropshire
Worcester
N. Wales ..
Sussex ....
Surrey ....
Chester....
Kent ......
Nottingham
Middlesex..
Suffolk ....
Southamp.
Lincoln ....
Devon ....
Lancaster..
Devon ....
Oxford ....
S. Wales ...
Norfolk ..
Middlesex
Chester ....
Hereford ..
Berks ....
Hereford ..
Worcester..
N. Wales ..
Dorset ....
Surrey ....
Norfolk....
---
Somerset ..
--
Berks ......
Average for
England
and Wales
Derby ....
Average for
England
and Wales
Durham ..
*** The rule is, that where the greatest number of males marry at an early age, the greatest number of females do so likewise—the exceptions being Dorset, Somerset, and Warwick, among the males, and Sussex, Lincoln, Durham, and Kent among the females.
††† There are, on an average, rather more than
3
females married at an early age to every male.
THE ILLEGITIMATE BIRTHS AND EARLY MARRIAGES IN THE SEVERAL
COUNTIES COMPARED.
Counties in which the Illegitimate Births and the Early Marriages are both above the Average.
Percent. above & below the Aver.
Counties in which the Illegitimate Births are above the Average and the Early Marriages below it.
Percent. above & below the Aver.
In No. of Illegitimate Births.
In No. of Early Marriages.
In No. of Illegitimate Births.
In No. of Early Marriages.
Among Males.
Among Females.
Among Males.
Among Females.
Norfolk............
Cumberland........
Nottingham ......
Hereford ..........
Suffolk ............
Salop ..............
Derby ............
Westmorland ......
Chester ............
North Wales ......
Leicester ..........
Northumberland ..
Berks ..............
South Wales ......
Lancaster ..........
*** In the majority of these counties some peculiar form of courtship (as "night courtship" and "bundling") prevails.
Counties in which the Illegitimate Children and Early Marriages are both below the Average.
Counties in which the Illegitimate Children are below the Average, and the Early Marriages above it.
Middlesex..........
Hunts..............
Surrey ............
Northampton ......
Cornwall ..........
Essex ..............
Monmouth ........
Worcester..........
Devon ............
Cambridge ........
Counties in which the Illegitimate Children and Early Marriages among Males are both below the Average, and those among Females above it.
Counties in which the Illegitimate Children and the Early Marriages among Females are both below the Average, and those among Males above it.
Kent .............
Warwick ..........
Durham ..........
Somerset ..........
Lincoln............
Dorset ............
*** The rule appears to be, that in those counties in which there are the greatest number of Early Marriages, there are (
generally
) the greatest number of Illegitimate Children, and
vice versâ.
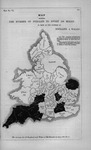
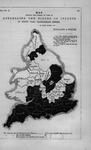
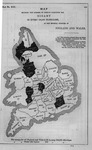
Map no. vi.
Map
Showing the Number of Females to Every
100
Males in Each of the Counties of England & Wales
*** The counties printed
black
are those in which the proportion of Females to Males is
above
the Average. The counties left
white
are those in which the proportion of Females to Males is
below
the Average.
The Average for all England and Wales is
105
Females to every
100
Males.
table SHOWING THE PROPORTION OF FEMALES TO MALES IN THE DIFFERENT COUNTIES OF ENGLAND AND WALES.
COUNTIES.
Number of Females to every
100
Males.
Proportion per Cent. above and below the Average. † denotes above. * below.
Male Population.
Female Population.
TOTAL FOR ENGLAND AND WALES . .
LIST OF COUNTIES IN THE ORDER OF THEIR PROPORTION OF FEMALE TO MALE POPULATION, AS SHOWN BY THE NUMBER OF FEMALES TO EVERY
100
MALES.
COUNTIES ABOVE THE AVERAGE.
COUNTIES BELOW THE AVERAGE.
Middlesex......
Chester ........
Gloucester ....
Lancaster ......
Devon ........
Leicester ......
Somerset ......
Nottingham ....
Surrey ........
Warwick ......
Bedford........
Worcester......
Cornwall ......
Bucks..........
Dorset ........
Cumberland ..
Norfolk........
Northumb. ....
Average for England & Wales
Stafford........
THE EXCESS OF FEMALES AND ILLEGITIMATE BIRTHS COMPARED.
Counties in which the Number of Females and Illegitimate Births are both above the Average.
Percentage above and below the Average. † denotes above and * below.
Counties in which the Number of Females is above and of the Illegitimate Births is below the Average.
Percentage above and below the Average. † denotes above and * below.
In No. of Females to Males.
In No. of Illegitimate Births.
In No. of Females to Males.
In No. of Illegitimate Births.
Bedford ....
Middlesex ....
Norfolk ....
Gloucester ..
Counties in which the Number of Females and Illegitimate Births are both below the Average.
Counties in which the Number of Females is below the Average and the Illegitimate Births above it.
Monmouth ..
Stafford ....
Rutland ....
Oxford ......
Lincoln ....
Hereford ....
Essex ......
Salop ........
Hunts ......
Derby ......
Kent ........
York ........
Cambridge ..
Hertford ....
Worcester....
Northumb. ..
*** The rule appears to be, that in those counties in which the number of females, in proportion to the males, is the
smallest
, the number of illegitimate births is the
greatest
, and where it is the
greatest
, the illegitimate births are the
smallest.
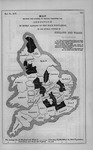
Map no. Vii.
Map
Showing the Number of Persons Committed For Rape in Every
10,000,000
of the Population, in the Several Counties of England and Wales.
*** The counties printed
black
are those in which the number committed for Rape is
above
the Average. The counties left
white
are those in which the number committed for Rape is
below
the Average. The Average has been calculated for the
ten
years from
841
to
.
The Average for all England and Wales is
in every
10,000,000
People.
table SHOWING THE CRIMINALITY OF THE DIFFERENT COUNTIES OF ENGLAND AND WALES WITH REGARD TO RAPE.
COUNTIES.
Average Population from
-
50
.
Total Number Committed for Rape.
Annual Average.
No. committed annually for Rape in every
10,000,000
Persons.
Proportion per Cent above and below the Aver. † denotes above. * " below.
Bedford . . .
...
...
...
...
Cambridge . .
...
...
...
Cumberland . .
...
...
...
...
...
...
...
Derby . . .
...
...
...
...
Dorset . . .
...
...
...
...
Hereford . .
...
...
...
...
...
...
Hunts . . .
...
...
...
...
...
...
...
Lincoln . . .
...
...
...
...
Northampton . .
...
...
...
Northumberland .
...
...
...
...
Nottingham . .
...
...
...
Rutland . . .
...
...
...
...
...
...
...
...
Sussex . . .
...
...
...
...
Westmorland . .
...
...
...
...
...
...
...
...
...
North Wales . .
...
...
...
...
Total for England and Wales .
*** The proportionate number of persons perpetrating this crime has been calculated with reference to the
entire
population, instead of the
male part of it only
, as at the
first
glance might seem necessary, males only being capable of committing the above offence. But it was found, on examination, that the intensity of the criminality in the several counties in this respect was influenced by the relative number of females. Monmouth contains the greatest number of males in proportion to females; so that, were the male population alone considered, the criminality of that county in the above respect would be considerably decreased. But the fact of there being more rapes in Monmouth than elsewhere would appear to be owing to the very excess of males over females in that county; the average, therefore, has been calculated from the entire population.
LIST OF COUNTIES IN THE ORDER OF THEIR CRIMINALITY WITH REGARD TO RAPE, AS SHOWN BY THE NUMBER COMMITTED FOR THIS OFFENCE IN EVERY
10,000,000
OF THE POPULATION.
Counties above the Average.
Counties below the Average.
Stafford ....
Berks ......
Chester ....
Suffolk ....
Average for England and Wales
Lincoln ....
THE CRIME OF RAPE COMPARED WITH THE NUMBER OF ILLEGITIMATE CHILDREN IN EACH COUNTY.
Counties in which the Number of Rapes and the Number of Illegitimate Births are both above the Average.
Percentage above and below the Average. † denotes above. * " below.
Counties in which the Number of Rapes is above and the Number of Illegitimate Births below the Average.
Percentage above and below the Average. † denotes above. * " below.
In Number of Rapes.
In No. of Illegitimate Births.
In Number of Rapes.
In No. of Illegitimate Births.
Hertford ....
Durham ....
Stafford ....
Essex........
Chester ......
Worcester....
Wilts ........
Rutland ....
Oxford ......
Northampton
Leicester ....
Gloucester ..
Counties in which the Number of Rapes and the Number of Illegitimate Births are both below the Average.
Counties in which the Number of Rapes is below and the Number of Illegitimate Births above the Average.
Dorset ......
Derby ......
Surrey ......
Lancaster ..
Cambridge ..
Hereford ....
Somerset ....
Sussex ......
Kent ........
Northumb...
Middlesex ..
York ........
Cornwall ....
*
Suffolk ......
*** The rule appears to be, that the crime of Rape is (in the majority of cases) the
least
where the number of Illegitimate Children is the
greatest.
THE CRIME OF RAPE COMPARED WITH THE RELATIVE NUMBER OF FEMALES TO MALES IN EACH COUNTY.
Counties in which the Number of Rapes and the Number of Females are both above the Average.
Percentage above and below the Average. † denotes above. * " below.
Counties in which the Number of Rapes is above and the Number of Females below the Average.
Percentage above and below the Average. † denotes above. * " below.
In Number of Rapes.
In No. of Females to Males.
In Number of Rapes.
In No. of Females to Males.
Gloucester ..
Bucks ......
Counties in which the Number of Rapes and the Number of Females are both below the Average.
Hertford ....
Lincoln......
Wilts ........
South Wales
Oxford ......
Lancaster....
*
Leicester ....
Hereford ....
Westmorland
Hunts ......
Counties in which the Number of Rapes is below and the Number of Females above the Average.
York ........
Devon ......
Kent ......
Dorset ......
Suffolk ......
Surrey ......
Salop ......
Somerset ....
Berks ......
Middlesex ..
*** The rule appears to be, that the number of Rapes is the
greatest
in those counties where the number of Females is the
least
Map no. Viii.
Map
Showing the Number of Persons Committed For Carnally abusing Girls Between the age of
Ten
and
Twelve
Years in Every
10,000,000
of the Population, in the Several Counties of England and Wales.
*** The counties printed
black
are those in which the number committed for this offence is
above
the Average. The counties left
white
are those in which the number committed for the same offence is
below
the Average. The Average has been calculated for the
ten
years from
to
.
The Average for all England and Wales is
3
in every
10,000,000
People. Westmoreland (the highest)
17
" "
table SHOWING THE CRIMINALITY OF THE DIFFERENT COUNTIES OF ENGLAND AND WALES WITH REGARD TO CARNALLY ABUSING GIRLS BETWEEN THE AGE OF
10
AND
12
YEARS.
COUNTIES.
Average Population from
-
50
.
Total number committed for carnally abusing girls between the age of
10
and
12
years.
Annual Average.
No. committed annually in every
10,000,000
Persons.
Proportion per Cent. above and below the Aver. † denotes above. * " below.
Bedford . . .
...
...
...
...
...
...
...
...
...
...
...
...
...
Berks . . .
...
...
...
...
...
...
...
...
...
Bucks . . .
...
...
...
...
...
...
...
...
Cambridge . .
...
...
...
...
...
...
...
...
...
Chester . .
...
...
...
...
...
...
...
...
Cornwall . .
...
...
...
...
...
...
...
...
...
Cumberland . .
...
...
...
...
...
...
...
...
...
...
...
...
...
Derby . . .
...
...
...
...
...
...
...
...
...
...
...
...
...
Devon . . .
...
...
...
...
...
...
...
...
...
...
...
...
...
Dorset . . .
...
...
...
...
...
...
...
...
...
...
...
...
...
Durham . .
...
...
...
...
...
...
...
...
...
...
...
...
...
Essex . . .
...
...
...
...
...
...
...
...
Gloucester . .
...
...
...
...
...
...
...
...
Hereford . .
...
...
...
...
...
...
...
...
...
...
...
...
...
Hertford . .
...
...
...
...
...
...
...
...
...
Hunts . . .
...
...
...
...
...
...
...
...
...
...
...
...
...
Kent . . .
...
...
...
...
...
Lancaster . .
...
...
...
...
...
...
...
Leicester . .
...
...
...
...
...
...
...
...
...
Lincoln . .
...
...
...
...
...
...
...
...
...
Monmouth . .
...
...
...
...
...
...
...
...
...
...
...
...
...
Norfolk . .
...
...
...
...
...
...
...
...
...
...
...
...
...
Northampton . .
...
...
...
...
...
...
...
...
...
Northumberland .
...
...
...
...
...
...
...
...
...
...
...
...
...
Nottingham . .
...
...
...
...
...
...
...
...
...
...
...
...
...
Oxford . . .
...
...
...
...
...
...
...
...
...
...
...
...
...
Rutland . .
...
...
...
...
...
...
...
...
...
...
...
...
...
Salop . . .
...
...
...
...
...
...
...
...
...
...
...
...
...
Somerset . .
...
...
...
...
...
...
...
Southampton . .
...
...
...
...
...
...
...
...
...
Stafford . . .
...
...
...
...
...
...
...
...
...
...
...
...
...
Suffolk . . .
...
...
...
...
...
...
...
...
...
...
...
...
...
Surrey . . .
...
...
...
...
...
...
...
Sussex . . .
...
...
...
...
...
...
...
...
...
...
...
...
...
Warwick . .
...
...
...
...
...
...
...
...
...
...
...
...
...
Westmorland . .
...
...
...
...
...
...
...
...
...
Wilts . . .
...
...
...
...
...
...
...
...
...
Worcester . .
...
...
...
...
...
...
...
York . . .
...
...
...
...
...
...
...
...
North Wales . .
...
...
...
...
...
...
...
...
...
...
...
...
South Wales . .
...
...
...
...
...
...
...
...
...
...
...
...
...
Total for England and Wales .
*** The proportionate number of persons perpetrating the above crime has been calculated with reference to the
entire
population, instead of the
male part of it only
, as at the
first
glance might seem necessary, males only being capable of committing the above offence. But it was found, on examination, that the intensity of the criminality in the several counties in this respect was influenced by the relative number of females (see comparative table below); the average, therefore, has been calculated from the entire population.
LIST OF COUNTIES IN THE ORDER OF THEIR CRIMINALITY WITH REGARD TO CARNALLY ABUSING GIRLS BETWEEN THE AGE OF
10
AND
12
YEARS, AS SHOWN BY THE NUMBER COMMITTED FOR THIS OFFENCE IN EVERY
10,000,000
OF THE POPULATION.
Counties above the Average.
Counties below the Average.
Average for England and Wales
Warwick
THE CRIME OF RAPE COMPARED WITH THAT OF CARNALLY ABUSING CHILDREN IN EACH COUNTY.
Counties in which the Number of Rapes and the Number of Cases of Carnal Abuse are both above the Average.
Percentage above and below the Average. † denotes above. * " below.
Counties in which the Number of Rapes is above and the Number of Cases of Carnal Abuse is below the Average.
Percentage above and below the Average. † denotes above. * " below.
In Number of Rapes.
In No. of Cases of Carnal Abuse.
In Number of Rapes.
In No. of Cases of Carnal Abuse.
Bucks........
Monmouth ..
Hertford ....
Stafford ......
Chester ......
Durham ....
Worcester ....
Essex ........
*
Wilts ........
Norfolk ......
Northampton
Oxford. ......
Leicester ...
Rutland .....
Westmorland
Southampton
*
Counties in which the No. of Rapes and the No. of Cases of Carnal Abuse are both below the Aver.
Counties in which the No. of Rapes is below and the No. of Cases of Carnal Abuses above the Aver.
Nottingham .
Surrey ......
North Wales .
Cambridge ..
Lincoln ......
*
Somerset ....
South Wales .
Kent ........
Cumberland .
Berks ........
Warwick ....
Middlesex....
Derby ......
*** The rule appears to be, that where the Number of Rapes is the
greatest
, the Number of Cases of Carnally Abusing Children is (generally speaking) the greatest also; and
vice versâ
, where the Rapes are the
least
, the carnal abuse of Children is the
least
likewise.
THE CRIME OF CARNALLY ABUSING CHILDREN COMPARED WITH THE NUMBER OF FEMALES TO MALES IN EACH COUNTY.
Counties in which the Carnal Abuse of Children and the Number of Females to Males are both above the Average.
Percentage above and below the Average. † denotes above. * " below.
Counties in which the Carnal Abuse of Children is above, and the Number of Females to Males below the Average.
Percentage above and below the Average. † denotes above. * " below.
In No. of Cases of Carnal Abuse.
In No. of Females to Males.
In No. of Cases of Carnal Abuse.
In No. of Females to Males.
Middlesex....
Westmorland
Somerset ....
Worcester ....
Gloucester ..
Bucks ......
Surrey ......
Kent ........
Counties in which the Carnal Abuse of Children and the No. of Females to Males are both below the Average.
Chester ......
*
South Wales .
Northampton
North Wales .
Leicester ....
Warwick ....
Wilts.........
Sussex ......
Counties in which the Carnal Abuse of Children is below and the No. of Females to Males above the Average.
Rutland .....
Norfolk......
Oxford ......
Dorset ......
Nottingham .
Devon ......
Northumb. ..
Bedford ....
Monmouth ..
Cornwall ....
*
Hunts .......
*** The rule appears to be, that the crime of Carnally Abusing is (generally speaking) the
greatest
in those Counties where the number of Females is the
least.
Map no. ix.
Map
Showing the Number of Persons Committed For Keeping Disorderly Houses in Every
10,000,000
of the Population, in the Several Counties of England and Wales.
*** The counties printed
black
are those in which the number of persons committed for keeping disorderly houses is
above
the Average. The counties left
white
are those in which the number of persons committed for keeping disorderly houses is
below
the Average. The Average is calculated for
10
years. The counties having no number affixed to them are those in which there have been no committals for the above offence during the last
10
years.
in every
10,000,000
of the Population.
"
Middlesex (the highest) is
" "
table SHOWING THE NUMBER OF PERSONS COMMITTED FOR KEEPING DISORDERLY HOUSES IN THE DIFFERENT COUNTIES OF ENGLAND AND WALES FOR THE UNDERMENTIONED YEARS.
COUNTIES.
Average Population from
-
50
.
Number Committed for keeping Disorderly Houses.
Annual Average.
No. committed annually in every
10,000,000
of the Population.
Proportion per Cent above and below the Aver. † denotes above. * " below.
Bedford . . .
...
...
...
...
...
...
...
...
...
...
...
...
...
Berks . . .
...
...
...
...
...
...
...
...
Bucks . . .
...
...
...
...
...
...
...
...
...
...
...
...
Cambridge . .
...
...
...
...
...
...
...
...
...
Cumberland . .
...
...
...
...
...
...
Derby . . .
...
...
...
...
...
...
...
...
...
Dorset . . .
...
...
...
...
...
...
...
Durham . . .
...
...
...
...
...
...
...
Essex . . .
...
...
...
...
...
...
...
...
...
Gloucester . .
...
...
...
Hereford . .
...
...
...
...
...
Herford . .
...
...
...
...
...
...
...
...
...
Hunts . . .
...
...
...
...
...
...
...
Kent . . .
...
...
...
...
...
...
...
...
Leicester . .
...
...
...
...
...
...
...
...
Monmouth . .
...
...
...
...
...
...
Norfolk . . .
...
...
...
...
...
...
...
Northampton . .
...
...
...
...
Northumberland .
...
...
...
...
...
...
...
Nottingham . .
...
...
...
...
...
...
...
...
...
...
...
...
...
Oxford . . .
...
...
...
...
...
...
...
...
Rutland . . .
...
...
...
...
...
...
...
...
...
...
...
...
...
Salop . . .
...
...
...
...
...
...
Southampton . .
...
...
...
...
...
...
Stafford . . .
...
...
...
Suffolk . . .
...
...
...
...
...
...
...
...
...
Surrey . . .
...
...
...
...
...
Sussex . . .
...
...
...
...
...
...
...
...
Warwick . .
...
...
...
...
...
Westmorland . .
...
...
...
...
...
...
...
...
...
Wilts . . .
...
...
...
...
...
...
North Wales . .
...
...
...
...
...
...
...
...
South Wales . .
...
...
...
...
...
...
...
...
...
...
...
...
...
Total for England and Wales .
LIST OF COUNTIES IN THE ORDER OF THEIR BROTHELS, AS SHOWN BY THE NUMBER OF PERSONS COMMITTED FOR KEEPING DISORDERLY HOUSES IN EVERY
10,000,000
OF THE POPULATION.
Counties above the Average.
Counties below the Average.
Middlesex ........
Hunts ..............
Lancaster..........
Lincoln ............
Cornwall ..........
Gloucester ..........
Worcester ........
Cumberland ........
Hereford ..........
Northumberland....
Northampton......
Durham ............
Chester............
York ..............
Average for England and Wales ........
Rutland ............
THE NUMBER OF DISORDERLY HOUSES COMPARED WITH THE NUMBER OF ILLEGITIMATE BIRTHS IN EACH COUNTY.
Counties in which the Number of Disorderly Houses and the Number of Illegitimate Children are both above the Average.
Percentage above and below the Average. † denotes above. * " below.
Counties in which the Number of Disorderly Houses is above and the Number of Illegitimate Children below the Average.
Percentage above and below the Average. † denotes above. * " below.
In No. of Disorderly Houses.
In No. of Illegitimate Children.
In No. of Disorderly Houses.
In No. of Illegitimate Children.
Lancaster . . . . . .
Middlesex . . . . . .
Hereford . . . . . . .
Cornwall . . . . . . .
Chester . . . . . . .
Worcester . . . . . .
Counties in which the Number of Disorderly Houses and the Number of Illegitimate Children are both below the Average.
Counties in which the Number of Disorderly Houses is below and the Number of Illegitimate Children above the Average.
Rutland . . . . . . .
South Wales . . . . . .
Kent . . . . . . .
Nottingham . . . . . .
Essex . . . . . . .
Bucks . . . . . . .
Cambridge . . . . . .
Bedford . . . . . . .
Dorset . . . . . . .
Suffolk . . . . . . .
Devon . . . . . . .
North Wales . . . . . .
Southampton . . . . . .
Derby . . . . . . .
Warwick . . . . . . .
Sussex . . . . . . .
Monmouth . . . . . .
Norfolk . . . . . . .
Surrey . . . . . . .
Oxford . . . . . . .
Somerset . . . . . . .
Leicester . . . . . . .
Durham . . . . . . .
Salop . . . . . . .
Gloucester . . . . . .
Hertford . . . . . . .
Lincoln . . . . . . .
Stafford . . . . . . .
Hunts . . . . . . .
Wilts . . . . . . .
*** The rule appears to be, that the number of Disorderly Houses is the
least
in those Counties where the number of Illegitimate Births is the
greatest
, and,
vice versâ
, the
greatest
where the Illegitimates are the
least.
Berks . . . . . . .
Map no. X.
Map
Showing the Number of Cases of Concealing the Births of infants in Every
10,000
Illegitimate Births, in Each County of England & Wales
*** The counties printed
black
are those in which the number of cases is
above
the Average. The counties left
white
are those in which the number of cases is
below
the Average. The Average is taken for the last
ten
years.
all England and Wales is
.........
in every
10,000
illegitimate births.
" "
Huntingdon and Rutland (the lowest)
" "
table SHOWING THE CRIMINALITY OF THE DIFFERENT COUNTIES OF ENGLAND AND WALES WITH REGARD TO THE CONCEALMENT OF THE BIRTHS OF INFANTS.
COUNTIES.
Average Yearly No. of Illegitimate Births.
Annual Average.
No. committed for concealments in every
10,000
Illegitimate Births.
Proportion per Cent. above and below the Aver. † denotes above. * " below.
Bedford . . .
...
...
...
...
...
...
...
...
Berks . . .
...
...
...
...
...
Bucks . . .
...
...
...
...
...
...
...
Cambridge . .
...
...
...
...
...
...
......
Chester . . .
...
...
...
...
Cumberland . .
...
...
...
...
...
Derby . . .
...
...
...
...
...
...
Hereford . .
...
...
...
...
...
Hertford . .
...
...
...
...
...
...
Hunts . . .
...
...
...
...
...
...
...
...
...
...
...
...
...
Leicester . .
...
...
...
Monmouth . .
...
...
...
...
...
...
Northampton . .
...
...
...
...
...
Northumberland .
...
...
...
...
...
...
Nottingham . .
...
...
...
...
...
...
...
Oxford . . .
...
...
...
...
...
...
...
...
...
Rutland . . .
...
...
...
...
...
...
...
...
...
...
...
...
...
Westmorland . .
...
...
...
...
...
...
...
North Wales . .
...
...
...
...
Total for England and Wales .
LIST OF COUNTIES, IN THE ORDER OF THEIR CRIMINALITY WITH REGARD TO THE CONCEALMENT OF THE BIRTHS OF INFANTS, AS SHOWN BY THE NUMBER COMMITTED FOR THIS OFFENCE IN EVERY
10,000
ILLEGITIMATE BIRTHS.
Counties above the Average.
Counties below the Average.
Surrey ..............
Cambridge ..........
Southampton ......
Stafford ............
Cornwall ..........
Norfolk ............
Monmouth ........
South Wales ........
Dorset ............
Chester ............
Devon ..............
Salop ..............
Gloucester ..........
Hertford............
Lincoln ............
Warwick ..........
Essex ..............
Derby ..............
Hereford ..........
York ..............
Westmorland ......
North Wales ........
Middlesex ........
Bucks ..............
Worcester ........
Lancaster ..........
Sussex ..............
Cumberland ........
Durham ............
Northumberland....
Berks .............
Bedford ............
Kent ..............
Nottingham ........
Northampton ......
Oxford ............
Suffolk ............
Hunts ..............
Leicester............
Rutland ............
Average for England and Wales ........
17
THE ATTEMPTS AT CONCEALING THE BIRTHS OF INFANTS AND ILLEGITIMATE BIRTHS COMPARED.
Counties in which the Number of cases of Concealing Births and Number of Illegitimate Births are both above the Average.
Percentage above and below the Average. † denotes above. * " below.
Counties in which the Number of cases of Concealing Births is above the Average and the Number of Illegitimate Births below it.
Percentage above and below the Average. † denotes above. * " below.
In No. of Cases of Concealing Births.
In No. of Illegitimate Births.
In No. of Cases of Concealing Births.
In No. of Illegitimate Births.
Hereford . . . . . . .
Surrey . . . . . . .
Westmorland . . . . . .
Southampton . . . . . .
Sussex . . . . . . .
Cornwall . . . . . . .
Berks . . . . . . .
Monmouth . . . . . .
Suffolk . . . . . . .
Dorset . . . . . . .
Leicester . . . . . . .
Devon . . . . . . .
Wilts . . . . . . .
Gloucester . . . . . .
The Average for the whole of the above Counties . . . . .
Lincoln . . . . . . .
(The Number of cases of Concealing Births is
22
in every
10,000
Illegitimate Births, and the Number of Illegitimate Births
88
in every
Births.)
Middlesex . . . . . .
The Average for the above Counties is
(The Number of cases of Concealing Births is
27
in every
10,000
Illegitimate Births, and the Number of Illegitimate Eirths
53
in every
Births.)
Counties in which the No. of cases of Concealing Births and No. of Illegitimate Births are both below the Average.
Counties in which the No. of cases of Concealing Births is below the Average and the No. of Illegitimate Births above it.
Rutland . . . . . . .
*----
Oxford . . . . . . .
Hunts . . . . . . .
Nottingham . . . . . .
Warwick . . . . . .
Bedford . . . . . . .
Cambridge . . . . . .
Northumberland . . . . .
The Average for the whole of the
Cumberland . . . . . .
above Counties is . . . .
Lancaster . . . . . .
(The Number of cases of Concealing Births is
13
in every
10,000
Illegitimate Births, and the Number of Illegitimate Births
58
in every
Births.)
Bucks . . . . . . .
Stafford . . . . . . .
*----
The Average for the whole of the above Counties is . . . .
(The Number of cases of Concealing Births is
12
in every
10,000
Illegitimate Births, and the Number of Illegitimate Births
79
in every
Births.)
Map no. xi.
Map
Showing the Number of Proved Cases of attempting to Procure the Miscarriage of Women in Every
10,000
Illegitimate Births, in the Several Counties of England and Wales.
*** The counties printed
black
are those in which the cases are
above
the Average. The counties left
white
are those in which the number of cases is
below
the Average. The Average is calculated for
ten
years.
is
1
in every
10,000
illegitimate births.
table SHOWING THE CRIMINALITY OF THE DIFFERENT COUNTIES OF ENGLAND AND WALES, WITH REGARD TO THE ATTEMPTS TO PROCURE THE MISCARRIAGE OF WOMEN.
COUNTIES.
Average Yearly No. of Illegitimate Births.
Total number committed for attempting to procure the miscarriage of women.
Annual Average.
No. committed annually in every
10,000
Illegitimate Births.
Proportion per Cent. above and below the Aver. † denotes above, * " below.
Bedford . . . .
..
..
..
..
..
..
..
..
..
..
..
..
..
Berks . . . .
..
..
..
..
..
..
..
..
..
Bucks . . . .
..
..
..
..
..
..
..
..
..
..
..
..
..
Cambridge . . .
..
..
..
..
..
..
..
..
..
..
..
..
..
Chester . . . .
..
..
..
..
..
..
..
..
Cornwall . . .
..
..
..
..
..
..
..
..
Cumberland . . .
..
..
..
..
..
..
..
..
..
..
..
..
..
Derby . . . .
..
..
..
..
..
..
..
..
..
Devon . . . .
..
..
..
..
..
..
..
..
..
Dorset . . . .
..
..
..
..
..
..
..
..
..
..
..
..
..
Durham . . .
..
..
..
..
..
..
..
..
..
..
..
..
..
Essex . . . .
..
..
..
..
..
..
..
..
..
..
..
..
..
Gloucester . . .
..
..
..
..
..
..
..
..
..
......
Hereford . . .
..
..
..
..
..
..
..
..
..
..
..
..
..
Hertford . . .
..
..
..
..
..
..
..
..
..
Hunts . . . .
..
..
..
..
..
..
..
..
..
..
..
..
..
Kent . . . .
..
..
..
..
..
..
..
..
..
..
..
..
..
Lancaster . . .
..
..
..
..
..
..
..
..
..
Leicester . . .
..
..
..
..
..
..
..
Lincoln . . . .
..
..
..
..
..
..
..
..
..
......
Middlesex . . .
..
..
..
..
..
..
..
..
Monmouth . . .
..
..
..
..
..
..
..
..
..
..
..
..
..
Norfolk . . . .
..
..
..
..
..
..
..
..
..
Northampton . .
..
..
..
..
..
..
..
..
Northumberland . .
..
..
..
..
..
..
..
..
..
......
Nottingham . . .
..
..
..
..
..
..
..
Oxford . . . .
..
..
..
..
..
..
..
..
..
..
..
..
..
Rutland . . . .
..
..
..
..
..
..
..
..
..
..
..
..
..
Salop . . . .
..
..
..
..
..
..
..
..
..
..
..
..
..
Somerset . . .
..
..
..
..
..
..
..
..
..
..
..
..
..
Southampton . .
..
..
..
..
..
..
..
..
..
..
..
..
..
Stafford . . . .
..
..
..
..
..
..
..
..
......
Suffolk . . . .
..
..
..
..
..
..
..
..
..
......
Surrey . . . .
..
..
..
..
..
..
..
..
..
..
..
..
..
Sussex . . . .
..
..
..
..
..
..
..
..
..
Warwick . . .
..
..
..
..
..
..
..
Westmorland. . .
..
..
..
..
..
..
..
..
..
..
..
..
..
Wilts . . . .
..
..
..
..
..
..
..
..
..
..
..
..
..
Worcester . . .
..
..
..
..
..
..
..
..
..
..
..
..
..
York . . . .
..
..
..
..
..
..
......
North Wales . . .
..
..
..
..
..
..
..
..
..
..
..
..
..
South Wales . . .
..
..
..
..
..
..
..
..
..
Total for England and Wales . . . .
LIST OF COUNTIES, IN THE ORDER OF THEIR CRIMINALITY WITH REGARD TO ATTEMPTING TO PROCURE THE MISCARRIAGE OF WOMEN, AS SHOWN BY THE NUMBER COMMITTED FOR THIS OFFENCE IN EVERY
10,000
ILLEGITIMATE BIRTHS.
Counties above the Average.
Counties below the Average.
Sussex ......
York ......
Leicester ....
Stafford ....
Devon ......
Lincoln ....
Warwick ....
Suffolk ....
Cornwall ....
Middlesex..
Chester ......
S. Wales ...
Derby........
Norfolk....
Hertford .....
Lancaster..
Berks ........
Bedford ....
Average for England and Wales
1
THE CONCEALMENT OF THE BIRTHS OF INFANTS AND THE ATTEMPTS TO PROCURE THE MISCARRIAGE OF WOMEN COMPARED.
Counties in which the Concealment of Births and attempts to procure Miscarriage are both above the Average.
Percentage above and below the Average. † denotes above. * " below.
Counties in which the Concealment of Births is above the Average, and the attempts to procure Miscarriage below it.
Percentage above and below the Average. † denotes above. * " below.
In No. of Concealment of Births.
In No. of Attempts at Miscarriage
In No. of Concealment of Births.
In No. of Attempts at Miscarriage
Cornwall ......
Surrey ........
Devon ........
Southampton ..
Sussex ........
Monmouth ....
Berks ........
Dorset ........
Northampton ..
Gloucester ....
*----
Leicester ......
Lincoln........
*----
The Average for the whole of the above Counties is ..
Essex ........
(The Number of cases of Concealing Births is
24
, and of Attempts at Miscarriage
4
in every
10,000
Illegitimate Births.)
Worcester ....
Counties in which the Concealment of Births and Attempts to procure Miscarriage are both below the Average.
The Average for the whole of the above Counties is ..
Rutland ......
(The Number of cases of Concealing Births is
26
, and Attempts at Miscarriage
0
.
4
in every
10,000
Illegitimate Births.)
Lancaster......
Counties in which the Concealment of Births is below the Average, and the Attempts to procure Miscarriage above it.
Salop ........
Nottingham ..
South Wales ..
Derby ........
Norfolk ......
Warwick ......
Stafford ......
*----
*----
Hertford ......
Cambridge ....
*----
Chester ........
The Average for the whole of the above Counties is ..
The Average for the whole of the above Counties is ..
(The Number of cases of Concealing Births is
14
, and Attempts at Miscarriage
0
.
7
in every
10,000
Illegitimate Births.)
(The Number of cases of Concealing Births is
12
, and Attempts at Miscarriage
3
in every
10,000
Illegitimate Births.)
THE ATTEMPTS TO PROCURE THE MISCARRIAGE OF WOMEN AND ILLEGITIMATE BIRTHS COMPARED.
Counties in which the Number of cases of Attempts at Miscarriage and Number of Illegitimate Births are both above the Average.
Percentage above and below the Average. † denotes above. * " below.
Counties in which the cases of Attempts at Miscarriage are above the Average and the Number of Illegitimate Births below it.
Percentage above and below the Average. † denotes above. * " below.
In No. of Attempts at Miscarriage
In No. of Illegitimate Births.
In No. of Attempts at Miscarriage
In No. of Illegitimate Births.
Sussex ........
Northampton ..
Leicester ......
Devon ........
Nottingham ..
Warwick ......
Chester ........
Cornwall ......
Derby ........
The Average for the whole of the above Counties is ..
The Average for the whole of the above Counties is ..
(The Number of cases of Attempts at Miscarriage is
4
in every
10,000
Illegitimate Births, and Number of Illegitimate Births
53
in every
Births.)
(The number of cases of Attempts at Miscarriage is
4
in
10,000
Illegitimate Births, and Number of Illegitimate Births
81
in every
Births.)
Counties in which the cases of Attempts at Miscarriage and Number of Illegitimate Births are both below the Average.
Counties in which the cases of Attempts at Miscarriage are below the Average and the Number of Illegitimate Births above it.
Cambridge ....
Bucks ........
Dorset ........
Cumberland ..
Durham ......
Hereford ......
Essex..........
Oxford ........
Hunts ........
Salop ..........
Kent ..........
Westmorland ..
Monmouth ....
Wilts ..........
Rutland ......
North Wales ..
Somerset ......
Lancaster ....
Southampton ..
Norfolk ......
Surrey ........
South Wales ..
Worcester......
Suffolk ........
*----
Middlesex ....
Northumb.....
*----
Lincoln........
*----
Stafford ......
*----
Gloucester ....
*----
York ..........
*----
The Average for the whole of the above Counties is ..
The Average for the whole of the above Counties is ..
(The Number of cases of Attempts at Miscarriage is .
4
in every
10,000
Illegitimate Births, and Number of Illegitimate Births
54
in every
Births.)
(The Number of cases of Attempts at Miscarriage is .
6
in every
10,000
Illegitimate Births, and Number of Illegitimate Births
78
in every
Births.)
Map no. Xii.
Map
Showing the Number of Persons Committed For assaults, With intent to Ravish and Carnally abuse, in Every
1,000,000
of the Population, in the Several Counties of England & Wales.
*** The counties printed
black
are those in which the number committed for this offence is
above
the Average. The counties left
white
are those in which the number committed for the same offence is
below
the Average. The Average has been calculated for the
ten
years, from
to
.
.........
in every
1,000,000
people.
table SHOWING THE CRIMINALITY OF THE DIFFERENT COUNTIES OF ENGLAND AND WALES, WITH REGARD TO ASSAULTS WITH INTENT TO RAVISH AND CARNALLY ABUSE.
COUNTIES.
Total Number Committed for Assaults, with intent to Ravish and Carnally Abuse.
Annual Average.
No. Committed Annually in every
1,000,000
.
Percentage above and below the Average. † denotes above. * " below.
Bedford . . . .
..
..
..
..
..
Cumberland . . .
..
..
..
Dorset . . . .
..
..
..
..
..
Hereford . . .
..
..
..
..
..
..
Hunts . . . .
..
..
..
..
..
..
..
Northumberland . .
..
..
..
Nottingham . . .
..
..
..
..
Rutland . . . .
..
..
..
..
..
..
..
..
..
Salop . . . .
..
..
..
..
..
Westmorland. . .
..
..
..
..
..
..
Total for England and Wales . . . .
LIST OF COUNTIES, IN THE ORDER OF THEIR CRIMINALITY WITH REGARD TO ASSAULTS WITH INTENT TO RAVISH AND CARNALLY ABUSE, AS SHOWN BY THE NUMBER COMMITTED FOR THIS OFFENCE IN EVERY
1,000,000
OF THE POPULATION.
Counties above the Average.
Counties below the Average.
Worcester ......
Hereford .........
Norfolk ..........
York ..............
Chester ..........
North Wales ......
Wilts ............
Lincoln ..........
Somerset ........
Cumberland ......
Kent ............
Hertford ..........
Southampton ....
Cambridge ........
Monmouth ......
Dorset ............
Northampton ....
Durham ..........
Oxford ..........
Berks ..........
Stafford ..........
Cornwall ..........
Leicester..........
Middlesex ........
Sussex ............
Devon ............
Warwick ........
Surrey ............
Bucks ............
Salop ............
Gloucester ........
Suffolk ..........
Lancaster ........
Northumberland ..
Westmorland ....
Hunts ............
Essex ............
Bedford ..........
Average for England and Wales ..........
83
Map no. Xiii.
Map
Showing the Number of Persons Committed For Bigamy in Every
100,000
Marriages, in the Several Counties of England and Wales.
*** The counties printed
black
are those in which the number committed for this offence is
above
the average. The counties left
white
are those in which the number committed for the same offence is
below
the average. The average is calculated for the
ten
years, from
to
.
in every
100,000
Marriages.
table SHOWING THE CRIMINALITY OF THE DIFFERENT COUNTIES OF ENGLAND AND WALES WITH REGARD TO BIGAMY.
COUNTIES.
Average Marriages for
10
years, from
-
48
.
Total Number committed for Bigamy.
Annual Average.
No. committed Annually in every
100,000
Marriages.
Percentage above and below the Average. † denotes above. * " below.
Bedford . . . .
..
..
..
..
..
..
..
Berks . . . .
..
..
..
..
..
Bucks . . . .
..
..
..
..
..
..
..
..
..
..
..
..
..
Cambridge . . .
..
..
..
..
..
..
..
Cornwall . . .
..
..
..
..
..
..
..
..
Cumberland . . .
..
..
..
Derby . . . .
..
..
..
..
..
..
..
Dorset . . . .
..
..
..
..
..
..
..
..
..
Essex . . . .
..
..
..
..
..
..
Gloucester . . .
..
..
..
..
Hereford . . .
..
..
..
..
..
..
Hertford . . .
..
..
..
..
..
..
..
..
..
..
..
..
..
Hunts . . . .
..
..
..
..
..
..
..
..
..
Leicester . . .
..
..
..
..
..
..
..
..
..
Monmouth . . .
..
..
..
..
Northampton . .
..
..
..
..
..
..
..
..
..
Northumberland . .
..
..
..
..
..
Nottingham . . .
..
..
..
..
..
..
..
Oxford . . . .
..
..
..
..
..
..
..
..
..
..
..
..
..
Rutland . . . .
..
..
..
..
..
..
..
..
..
..
..
..
..
Salop . . . .
..
..
..
..
..
..
Southampton . .
..
..
..
..
..
..
..
Suffolk . . . .
..
..
..
..
..
..
..
..
Sussex . . . .
..
..
..
..
..
..
..
Westmorland . .
..
..
..
..
..
..
..
..
Wilts . . . .
..
..
..
..
..
..
..
..
North Wales . . .
..
..
..
..
South Wales . . .
..
..
..
..
Total for England and Wales . . . .
LIST OF COUNTIES, IN THE ORDER OF THEIR CRIMINALITY WITH REGARD TO BIGAMY, AS SHOWN BY THE NUMBER COMMITTED FOR THIS OFFENCE IN EVERY
100,000
MARRIAGES.
Counties above the Average.
Counties below the Average.
Chester ..........
York ..............
Cumberland ......
Berks ............
Lancaster ..........
Kent ............
Durham .........
Lincoln ..........
Surrey ............
Westmorland ....
Monmouth ......
Stafford ..........
Middlesex ........
Hunts ............
Hereford ..........
Worcester ........
Warwick ..........
Gloucester ........
Average for England and Wales ..........
59
Map no. Xiv.
Map
Showing the Number of Persons Committed For abduction in Every
10,000,000
of the Male Population, in the Several Counties of England and Wales.
*** The counties printed
black
are those in which the number committed for this offence is
above
the average. The counties left
white
are those in which the number committed for the same offence is
below
the average. The average is calculated for the
ten
years, from
to
.
The Average for all England and Wales is
............
in every
10,000,000
of the Male Population.
" "
Nottingham and Bucks (the highest)
table SHOWING THE CRIMINALITY OF THE DIFFERENT COUNTIES OF ENGLAND AND WALES WITH REGARD TO ABDUCTION.
COUNTIES.
Average Male Population
-
50
.
Total Number committed for Abduction.
Annual Average.
No. committed Annually in every
10,000,000
Males.
Percentage above and below the Average. † denotes above. * " below.
Bedford . . . .
..
..
..
..
..
..
..
..
..
..
..
..
..
Berks . . . .
..
..
..
..
..
..
..
..
..
Bucks . . . .
..
..
..
..
..
..
..
..
..
Cambridge . . .
..
..
..
..
..
..
..
..
..
Chester . . . .
..
..
..
..
..
..
..
..
..
..
..
..
..
Cornwall . . .
..
..
..
..
..
..
..
..
..
..
..
..
..
Cumberland . . .
..
..
..
..
..
..
..
..
..
..
..
..
..
Derby . . . .
..
..
..
..
..
..
..
..
..
..
..
..
..
Devon . . . .
..
..
..
..
..
..
..
..
..
..
..
..
..
Dorset . . . .
..
..
..
..
..
..
..
..
..
..
..
..
..
Durham . . . .
..
..
..
..
..
..
..
..
..
..
..
..
..
Essex . . . .
..
..
..
..
..
..
..
..
..
..
..
..
..
Gloucester . . .
..
..
..
..
..
..
..
..
..
..
..
..
..
Hereford . . . .
..
..
..
..
..
..
..
..
..
..
..
..
..
Hertford . . . .
..
..
..
..
..
..
..
..
..
..
..
..
..
Hunts . . . .
..
..
..
..
..
..
..
..
..
..
..
..
..
Kent . . . .
..
..
..
..
..
..
..
..
..
*....
Lancaster . . .
..
..
..
..
..
..
..
..
Leicester . . . .
..
..
..
..
..
..
..
..
..
..
..
..
..
Lincoln . . . .
..
..
..
..
..
..
..
..
..
..
..
..
..
Middlesex . . .
..
..
..
..
..
..
..
..
Monmouth . . .
..
..
..
..
..
..
..
..
..
..
..
..
..
Norfolk . . . .
..
..
..
..
..
..
..
..
..
..
..
..
..
Northampton . . .
..
..
..
..
..
..
..
..
..
..
..
..
..
Northumberland . .
..
..
..
..
..
..
..
..
..
Nottingham . . .
..
..
..
..
..
..
..
..
..
Oxford . . . .
..
..
..
..
..
..
..
..
..
..
..
..
..
Rutland . . . .
..
..
..
..
..
..
..
..
..
..
..
..
..
Salop . . . .
..
..
..
..
..
..
..
..
..
..
..
..
..
Somerset . . .
..
..
..
..
..
..
..
..
..
..
..
..
..
Southampton . . .
..
..
..
..
..
..
..
..
..
..
..
..
..
Stafford . . . .
..
..
..
..
..
..
..
Suffolk . . . .
..
..
..
..
..
..
..
..
..
..
..
..
..
Surrey . . . .
..
..
..
..
..
..
..
..
Sussex . . . .
..
..
..
..
..
..
..
..
..
..
..
..
..
Warwick . . .
..
..
..
..
..
..
..
..
Westmorland . . .
..
..
..
..
..
..
..
..
..
..
..
..
..
Wilts . . . .
..
..
..
..
..
..
..
..
..
..
..
..
..
Worcester . . .
..
..
..
..
..
..
..
..
..
..
..
..
..
York . . . .
..
..
..
..
..
..
..
..
..
..
..
..
..
North Wales . . .
..
..
..
..
..
..
..
..
..
..
..
..
..
South Wales . . .
..
..
..
..
..
..
..
..
..
..
..
..
..
Total for England and Wales . . .
..
..
..
LIST OF COUNTIES, IN THE ORDER OF THEIR CRIMINALITY WITH REGARD TO ABDUCTION, AS SHOWN BY THE NUMBER COMMITTED FOR THIS OFFENCE IN EVERY
10,000,000
OF THE MALE POPULATION.
Counties above the Average.
Counties below the Average.
Nottingham ........
Kent................
Bucks ..............
Middlesex ..........
Cambridge ..........
Bedford ............
Stafford ............
Chester ............
Berks ..............
Cornwall ..........
Warwick ..........
Cumberland ........
Lancaster ..........
Derby ..............
Northumberland....
Devon ..............
Surrey ............
Dorset ............
Average for England and Wales........
3
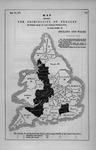
Map no. xv.
Map
Showing the Criminality of Females in Every
100,000
of the Female Population, in Each County of England and Wales.
*** The counties printed
black
are those in which the number of Criminal Females is
above
the average. The counties left
white
are those in which the number of Criminal Females is
below
the average. The average is taken for the last
10
years.
in every
100,000
of the Female Population.
table SHOWING THE RELATIVE AMOUNT OF FEMALE AND MALE CRIMINALITY IN THE SEVERAL COUNTIES OF ENGLAND AND WALES.
† denotes above the average, * below it.
COUNTIES.
Average Female Population,
-
50
.
Number of Female Criminals in each year.
Total Female Criminals in
Ten
Years.
Average No. of Female Criminals per year,
-
50
.
Average No. of Male Criminals
The average number of Male Criminals has been arrived at in the same manner as that for Female Criminals, but the table itself is reserved for another place.
per year,
-
50
.
No. of Female Criminals in every
100,000
of Female Population.
No. of Male Criminals in every
100,000
of Male Population.
Percentage above and below the Average of Female Criminals.
Percentage above and below the Average of Male Criminals.
No. of Female Criminals to every
100
Male Criminals.
Percentage above and below the Average of Female to Male Criminals.
Total for England & Wales
LIST OF COUNTIES, IN THE ORDER OF THEIR CRIMINALITY AMONGST FEMALES, AS SHOWN BY THE NUMBER OF FEMALE CRIMINALS IN EVERY
100,000
OF THE FEMALE POPULATION.
Counties above the Average.
Counties below the Average.
Stafford ....
Berks ......
Average for England and Wales
62